Open three different sites and search "North Bend home prices" and you'll get three different stories. One shows values climbing more than 100 percent in a year. Another shows the typical home losing value. A third shows the price per square foot sliding for two straight months. Same town, same summer, three contradictions.
The instinct is to pick the number that fits your plans and ignore the rest. That's the wrong move. The disagreement itself is the useful part. Once you understand why North Bend's numbers keep contradicting each other, you'll know how to read this market better than anyone quoting a single headline stat.
The number itself is the tell
Start with the most dramatic figure. In January 2026, North Bend's median sale price came in at $1.2 million, a jump of 103.1 percent from the year before, with homes selling in an average of 10 days compared to 32 days the prior January. On its face, that reads like a market on fire.
Look one line down and the picture changes. Only 4 homes sold in North Bend that January, down from 16 the year before. A median built from 4 transactions isn't measuring the market. It's measuring whichever 4 houses happened to close. If two of them were newer builds on acreage and the other two were modest resales, the "median" tells you almost nothing about what a typical buyer paid.
Compare that to two other snapshots from the same year. As of late May 2026, the typical home value in North Bend was $933,616, down 5.5 percent over the prior twelve months. By July 2026, the median list price had settled at $899,000, down 4 percent from June and 3 percent from the year before, with price per square foot down a similar 3 to 4 percent and days on market holding steady at 48. None of these numbers agree with the January spike, and none of them should have to. They're drawing from different slices of a market too thin to produce a stable headline in any given month.
Two housing markets sharing one zip code
The real explanation isn't statistical noise alone. It's that North Bend's sales mix genuinely spans two different products, and whichever one closes more often in a given month will swing the median hard in that direction.
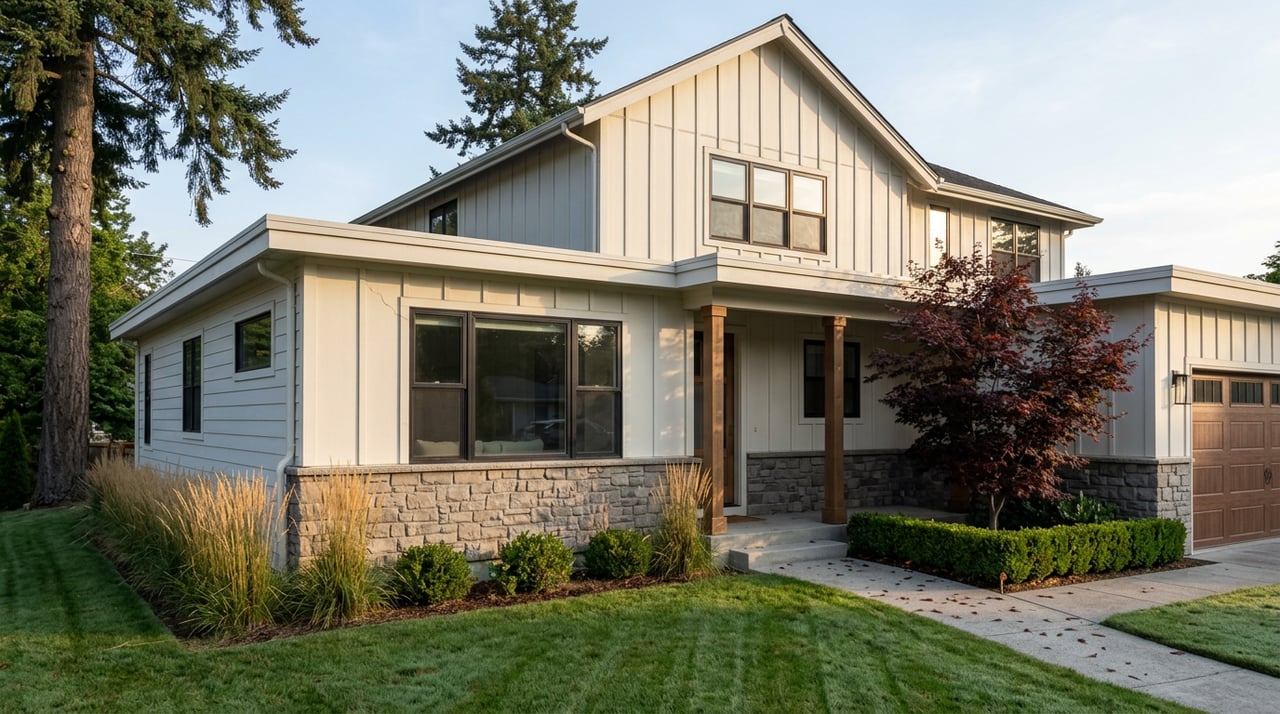
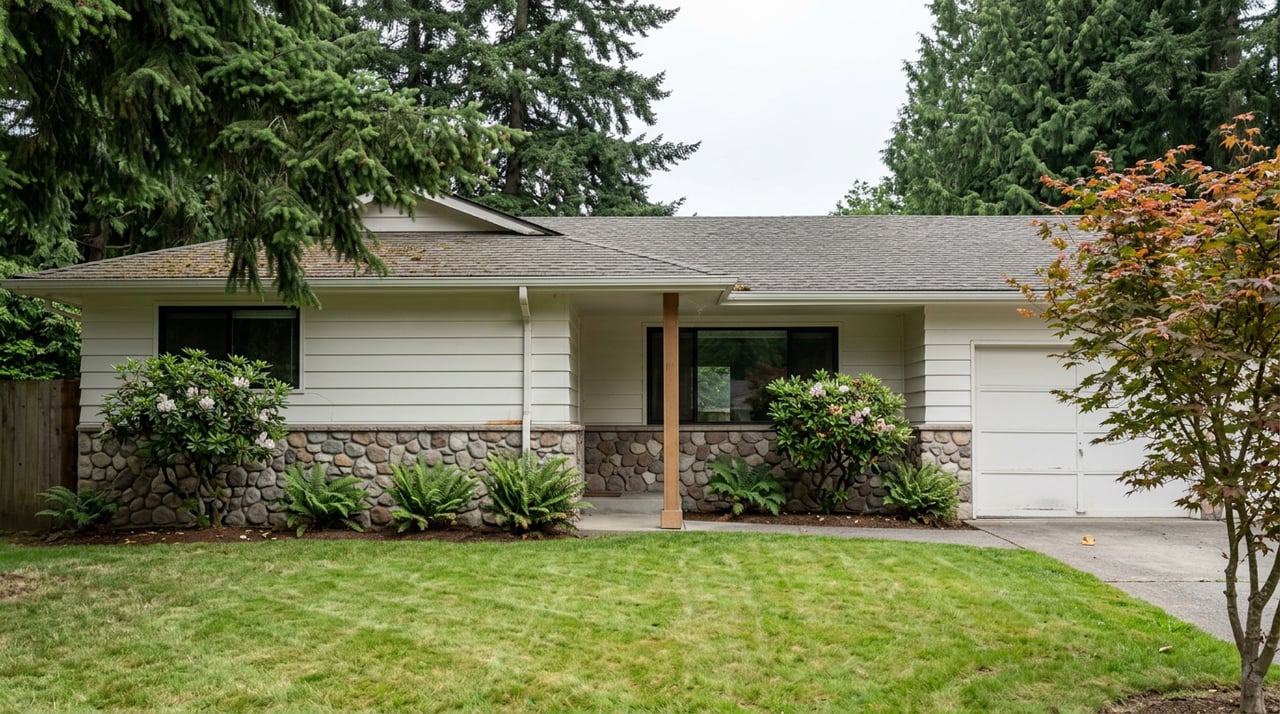
On one side sit the town's established, river-adjacent neighborhoods. Si View and Cedar Village, set around cul-de-sacs near the South Fork Snoqualmie River and shaded by mature pines, hold a mix of 1970s contemporary, Craftsman, and rambler-style homes, with river-close custom properties commanding $850,000 to $1.5 million. Riverbend adds a more modest layer, with ramblers on small driveways and single-car garages. Newer condos and townhomes near the Middle Fork Snoqualmie River typically run $600,000 to $800,000.
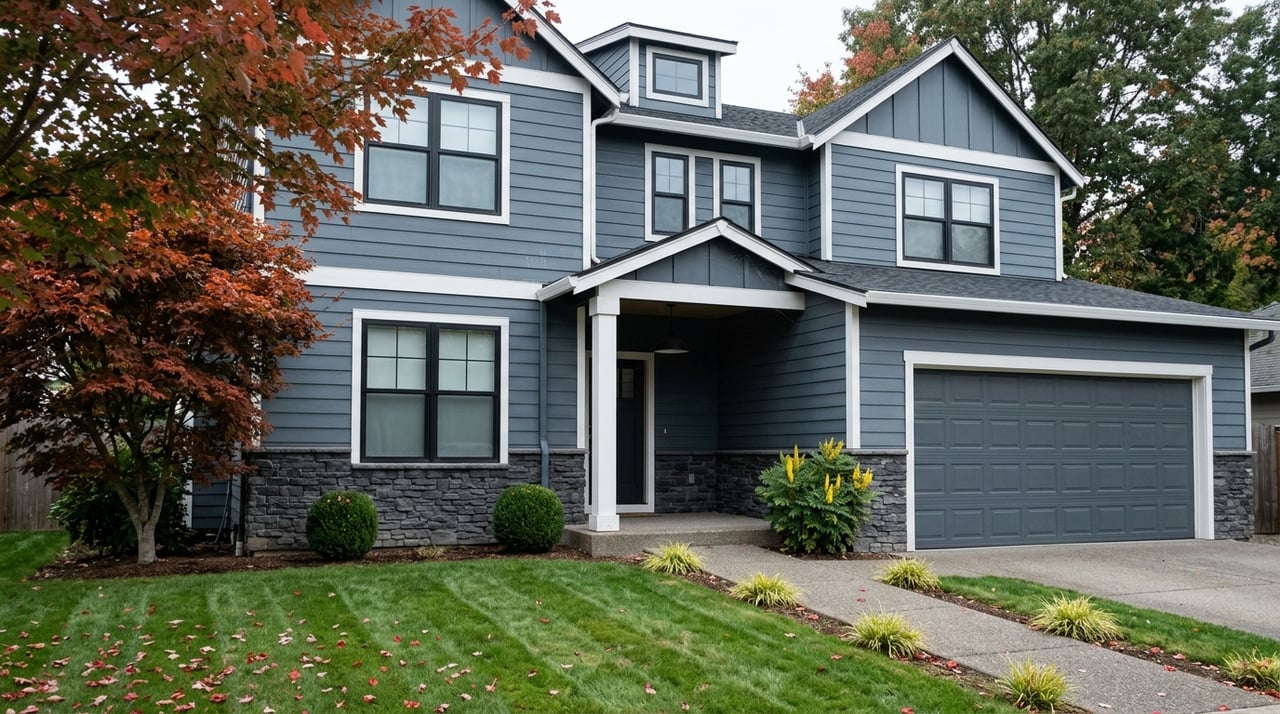
On the other side is a wave of new construction clustered at the base of Mt. Si. Three Rivers, an 11-home community from William Buchan Homes, is building 5-bedroom houses starting around 5,000 square feet on 1.2 to 2.5 acre lots, with an original completion target of April 2026. Timberstone Townhomes, built by D.R. Horton along the Snoqualmie Valley Trail, is a separate new-construction community in the same base-of-the-mountain corridor. Kanim Grove, a 12-homesite community from MainVue Homes also at the base of Mt. Si, is now sold out entirely.
| Established river neighborhoods | New construction at the base of Mt. Si | |
|---|---|---|
| Examples | Si View, Cedar Village, Riverbend | Three Rivers, Timberstone Townhomes, Kanim Grove (sold out) |
| Typical era | 1970s to present, resale stock | Built 2024 to 2026 |
| Price band | $600,000 to $1.5 million | Custom lots and larger-footprint new builds priced above $1.3 million |
| What pulls the median | Down, toward established resale values | Up, toward new-build premiums |
The same January 2026 data that produced the 103 percent headline also shows why days on market can vary wildly within that same window. One custom home at 43940 SE 80th St sold for $1,785,000 with zero days on market, essentially spoken for before it hit the open market. A few streets over, a new-construction home built by D.R. Horton, six bedrooms and 3,012 square feet, closed the same week for $1,349,995 after sitting for 174 days. A citywide median built from sales like these isn't measuring momentum. It's averaging two different buyer pools that happen to be shopping the same town.
The list-to-sold gap tells you which side is moving
An April 2026 snapshot of active inventory put the median list price at $1,019,900 against an average list price of $1,144,759, with 79 homes on the market and 23 sales in the prior 30 days. The median sold price for that stretch ran closer to $1,186,500, roughly $166,000 above the median list price of what was still sitting unsold.
That gap is the tell. It means the homes actually changing hands were, on balance, priced above what the bulk of current listings are asking, which points to moderately priced, well-positioned resale homes closing while higher-priced listings linger. Days on market backs this up: a median of 43 days against an average of 63 days in that same window means roughly half of April's sales moved within six weeks, while the other half took considerably longer. That's a bimodal market, not a smooth one, and it's exactly what you'd expect from a town selling two different products under one banner.
It's not just North Bend
This same split shows up next door in Snoqualmie. A market analysis covering conditions through June 2026 put the citywide median around $1.1 million with homes taking 33 days to go under contract. Snoqualmie Ridge, the planned community on the plateau above the valley, told a different story entirely: a median of $1.47 million, up 17.8 percent year over year, with homes averaging just 4 days on market. The rest of the city, outside the Ridge, showed a reported softening of around 12 percent year over year, a figure worth treating cautiously given how few sales it's built on.
The pattern is the same one playing out in North Bend. Wherever a small Cascade foothill town holds both an older, established housing stock and a newer planned or infill community, the citywide median becomes close to useless without knowing which side of town a given sale came from.
What this means if you're actually buying or selling
If you're comparing North Bend to other options on the Eastside, the headline percentage you saw quoted somewhere is the least useful number in the search. What matters more:
- Which comps did the agent actually use? A new-construction comp at Three Rivers tells you nothing about pricing a rambler in Riverbend, and vice versa.
- How long did comparable homes actually sit? A 174-day close on one new-construction home versus a zero-day sale on SE 80th St, both in the same month, shows the range you should expect, not a single average.
- Is the property closer to the river-adjacent established neighborhoods or the newer builds near Mt. Si? Those two markets are pricing differently right now, and treating them as one is how buyers overpay or sellers underprice.
If you're a seller, the list-to-sold gap from earlier in 2026 is a caution against pricing off an aspirational new-construction comp when your home sits in an established resale pocket. If you're a buyer weighing North Bend's outdoor access against a shorter commute elsewhere, it helps to know the town continues investing in its own infrastructure. The city has budgeted roughly $8.6 million for a roundabout at SR-202 and Mt Si Boulevard specifically to improve access to local businesses, the outlet mall, and a planned hotel, and Si View Metropolitan Park District is partway through a 5-mile connector trail linking Tennant Trailhead Park to Snoqualmie Point Park and the Rattlesnake Mountain Scenic Area, expected to finish in 2027. None of that shows up in a monthly median, but it shapes where demand concentrates over the next few years.
Regional coverage has noted for years that Seattle-area buyers drawn to North Bend's small-town character have been part of what's pushed prices up over time. That long-term pull is real. It just doesn't explain why one month's number contradicts the next.
A few common questions
Is North Bend currently a buyer's market or a seller's market? It depends on which slice you're looking at. Inventory and pricing data from April 2026 leaned toward buyers, with more listings and a widening gap between list and sold prices. Later data from July 2026 showed a flatter market, with days on market holding steady rather than stretching further. Neither label fits the whole town.
Why do Zillow, Redfin, and Movoto show different numbers for the same period? Each pulls from a different calculation, whether it's a home value index, a point-in-time median of closed sales, or a median of active list prices. In a market with only a handful of monthly sales, small differences in methodology produce large differences in the headline.
Should I compare North Bend to Snoqualmie using citywide medians alone? No. Both towns hold a similar split between established resale neighborhoods and a newer planned or infill segment, and citywide figures blend the two in ways that don't reflect either sub-market on its own.
If you're trying to figure out which side of North Bend actually fits your budget and your timeline, that's the kind of question worth working through with someone who tracks these sales as they close, not just as they get reported. You can start by browsing the North Bend neighborhood guide, or reach out directly through the buyer resources page if you're comparing North Bend against other Eastside options, or the seller resources page if you're trying to price a home correctly in a market this uneven.
Andrew M. Wenzl has spent a decade working Eastside and foothill transactions across Puget Sound, and knows the difference between a headline number and the sale that actually happened next door. Let's Connect if you want a read on North Bend that goes past whatever a portal is showing this week.